
A selection of research and applied projects spanning LLM pipelines, causal inference, reinforcement learning, and computational economics. Source code and papers linked where available.
🔬 Featured Research Projects
The Energy Cost of Artificial Intelligence: Modeling AI-Driven Data Center Electricity Demand with LLM Predictions
Danbo Chen (The Ohio State University), Zijun Zhou (Meta Platform)
American Agricultural Economics Association (AAEA) Conference, 2026
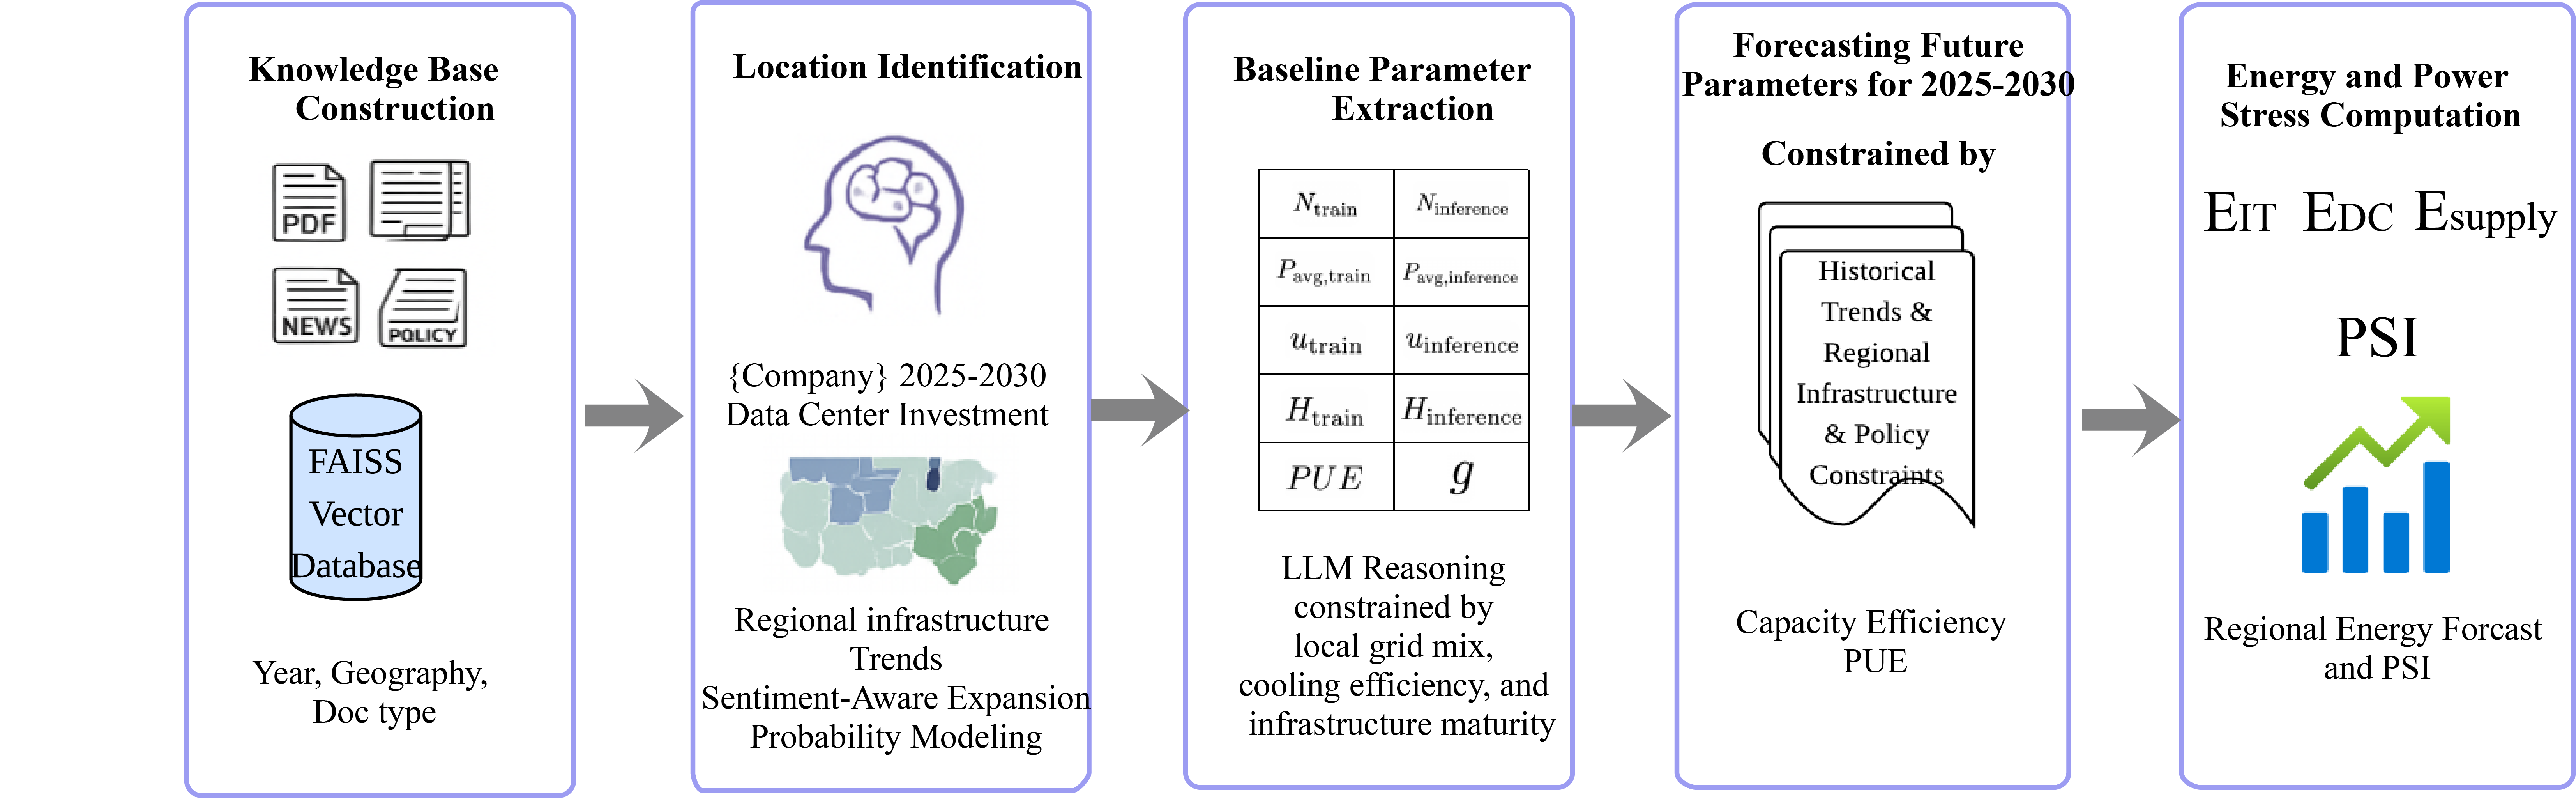
Built a RAG + LLM pipeline to extract and synthesize firm-level data center investment signals from SEC EDGAR filings, ESG reports, and earnings calls — then used those signals to forecast electricity demand (2025–2030) across six hyperscalers (Amazon, Microsoft, Google, Meta, Oracle, Apple). Constructed a Regional Power Stress Index (PSI) to quantify grid stress from spatially concentrated AI loads.
Key results: 6-firm baseline of 118 TWh (2024) → projected 239–295 TWh by 2030 (13–17% CAGR). Identified >10 high-stress corridors where AI demand alone exceeds 25% of regional supply.
Python LangChain FAISS GPT-4o-mini all-MiniLM-L6-v2 Google Earth Engine Landsat 8 Pandas SQL
Global AI Data Center Siting: Spatial Econometrics and Strategic Firm Behavior
Danbo Chen (The Ohio State University)
Working Paper
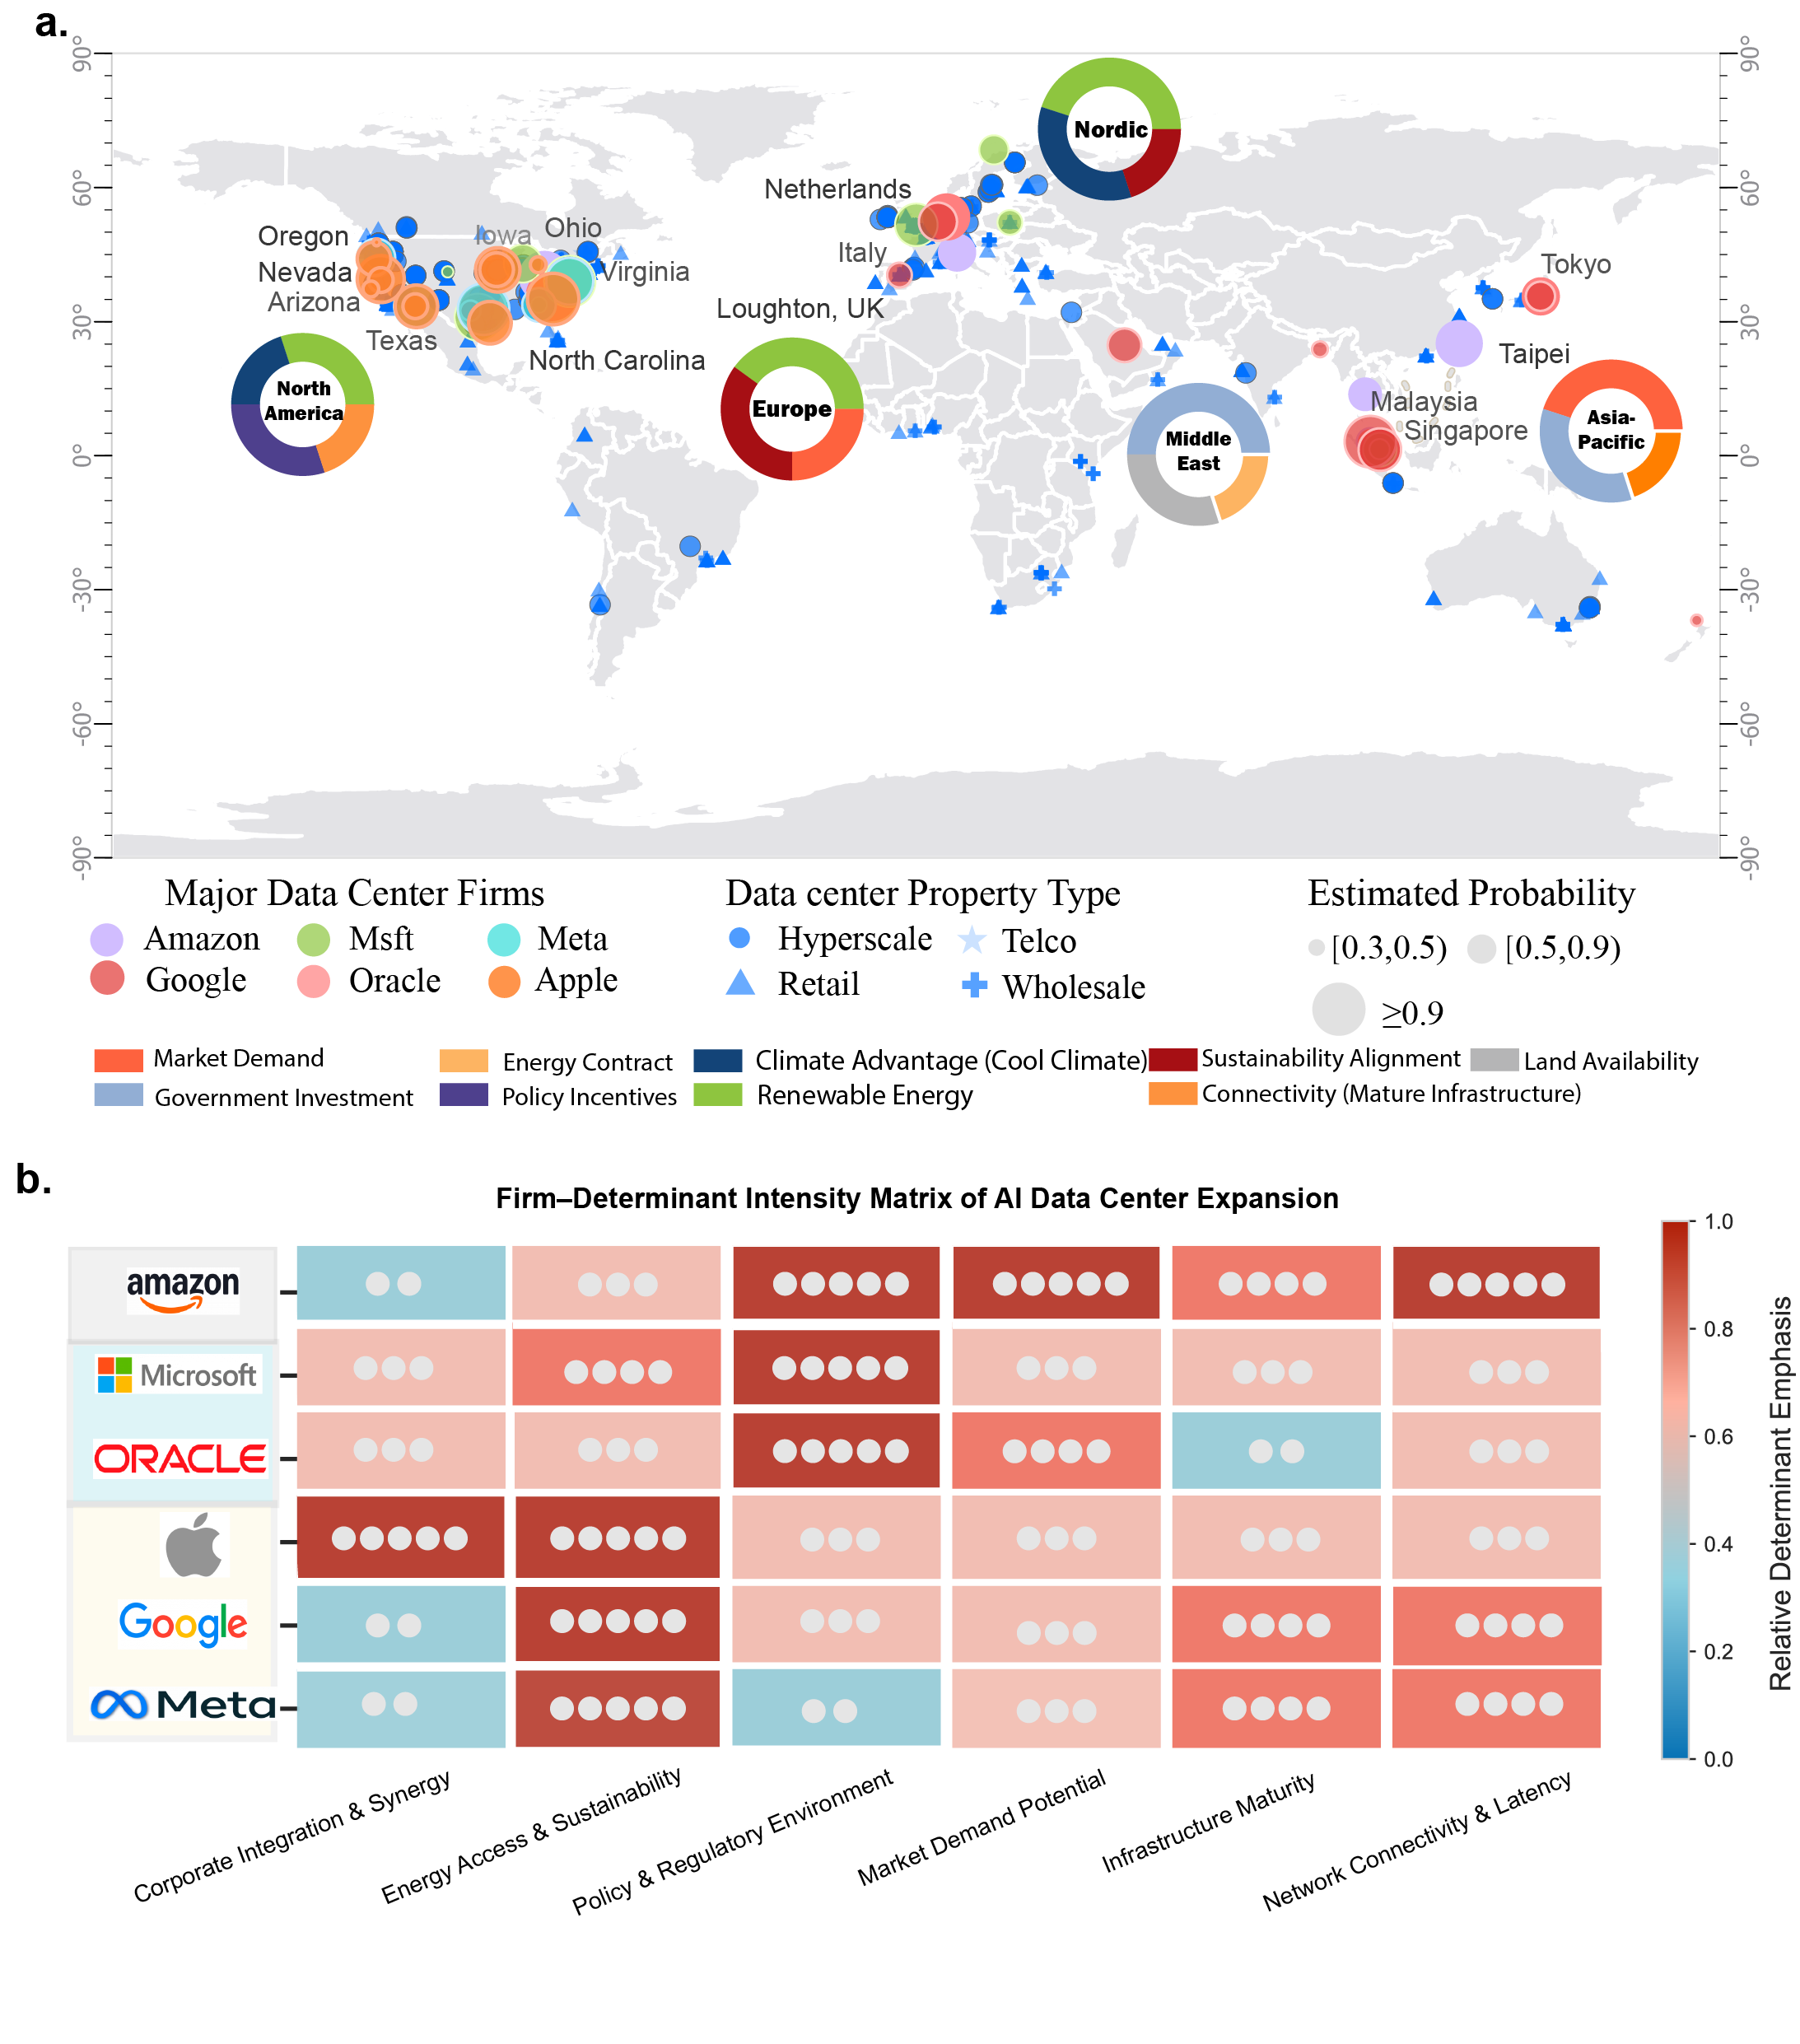
Identified five strategic siting archetypes among hyperscalers using a firm–determinant intensity matrix built from geospatial, policy, and infrastructure data. Modeled siting probability using location characteristics (renewable access, policy corridors, connectivity, PUE) across North America, Western Europe, and Asia–Pacific.
Key finding: >90% of AI compute concentrates in 12 metro regions; siting is driven by grid reliability and policy incentives rather than user proximity.
Python GeoPandas Google Earth Engine Sentinel-2 Spatial Econometrics S&P Capital IQ
🤖 ML / Applied AI Projects
Neural Machine Translation: From LSTM to Transformer — A Bottom-Up Implementation Study
Danbo Chen
CS 7643 Deep Learning, Georgia Institute of Technology, Spring 2026
Implemented and compared four neural sequence models for English↔German translation on the Multi30k dataset (29K sentence pairs), building each architecture from scratch in PyTorch:
- LSTM from scratch — all four gates (input, forget, cell, output) via
nn.Parameterwith Xavier initialization - Seq2Seq with attention — LSTM encoder-decoder with cosine similarity attention mechanism
- Transformer encoder — single-layer: positional embeddings, 2-head self-attention, FFN, LayerNorm, applied to CoLA grammaticality classification
- Full Transformer —
nn.Transformerencoder-decoder with causal masking, padding masks, and greedy autoregressive decoding
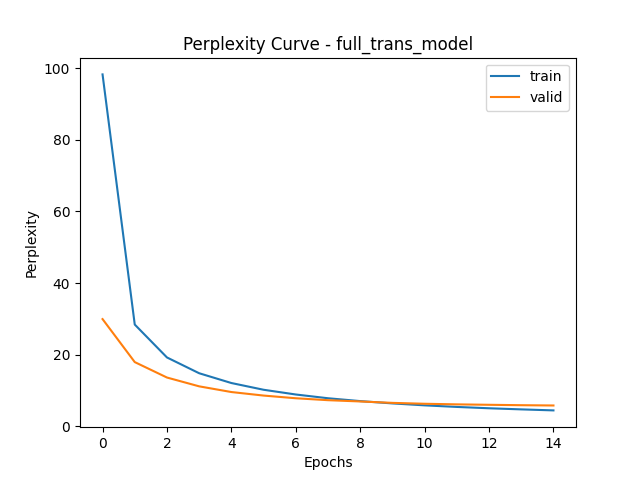
Key result: Full Transformer achieved val perplexity of 6.9 vs Seq2Seq’s 25.4 at convergence — 3.7× lower — while training 2× faster per epoch, quantifying the practical gain of attention over recurrence on a real parallel corpus.
Python PyTorch Jupyter Multi30k Transformer Seq2Seq LSTM Attention
Consumer Shopping Behaviour Analysis — 2026
Danbo Chen
Full-Stack Data Science Portfolio Project
End-to-end analysis of 11,789 consumers across demographic, digital, behavioural, and spending dimensions. Built a full ML pipeline covering EDA, feature engineering, K-Means clustering, multi-class classification, and regression, with SHAP explainability to interpret model predictions. Produced an interactive dashboard summarizing shopping preferences, city-tier breakdowns, and spend-channel splits.
- Dashboard & Visualization — Interactive Plotly KPI dashboard; Sankey, Sunburst, Parallel Coordinates, radar charts, and seaborn heatmaps across 14 analytical sections
- Machine Learning — K-Means clustering (4 consumer personas via PCA); multi-class classifier benchmarking RF, GBM, XGBoost, LightGBM with 5-fold CV; GBM regression for online spend with SHAP beeswarm explainability
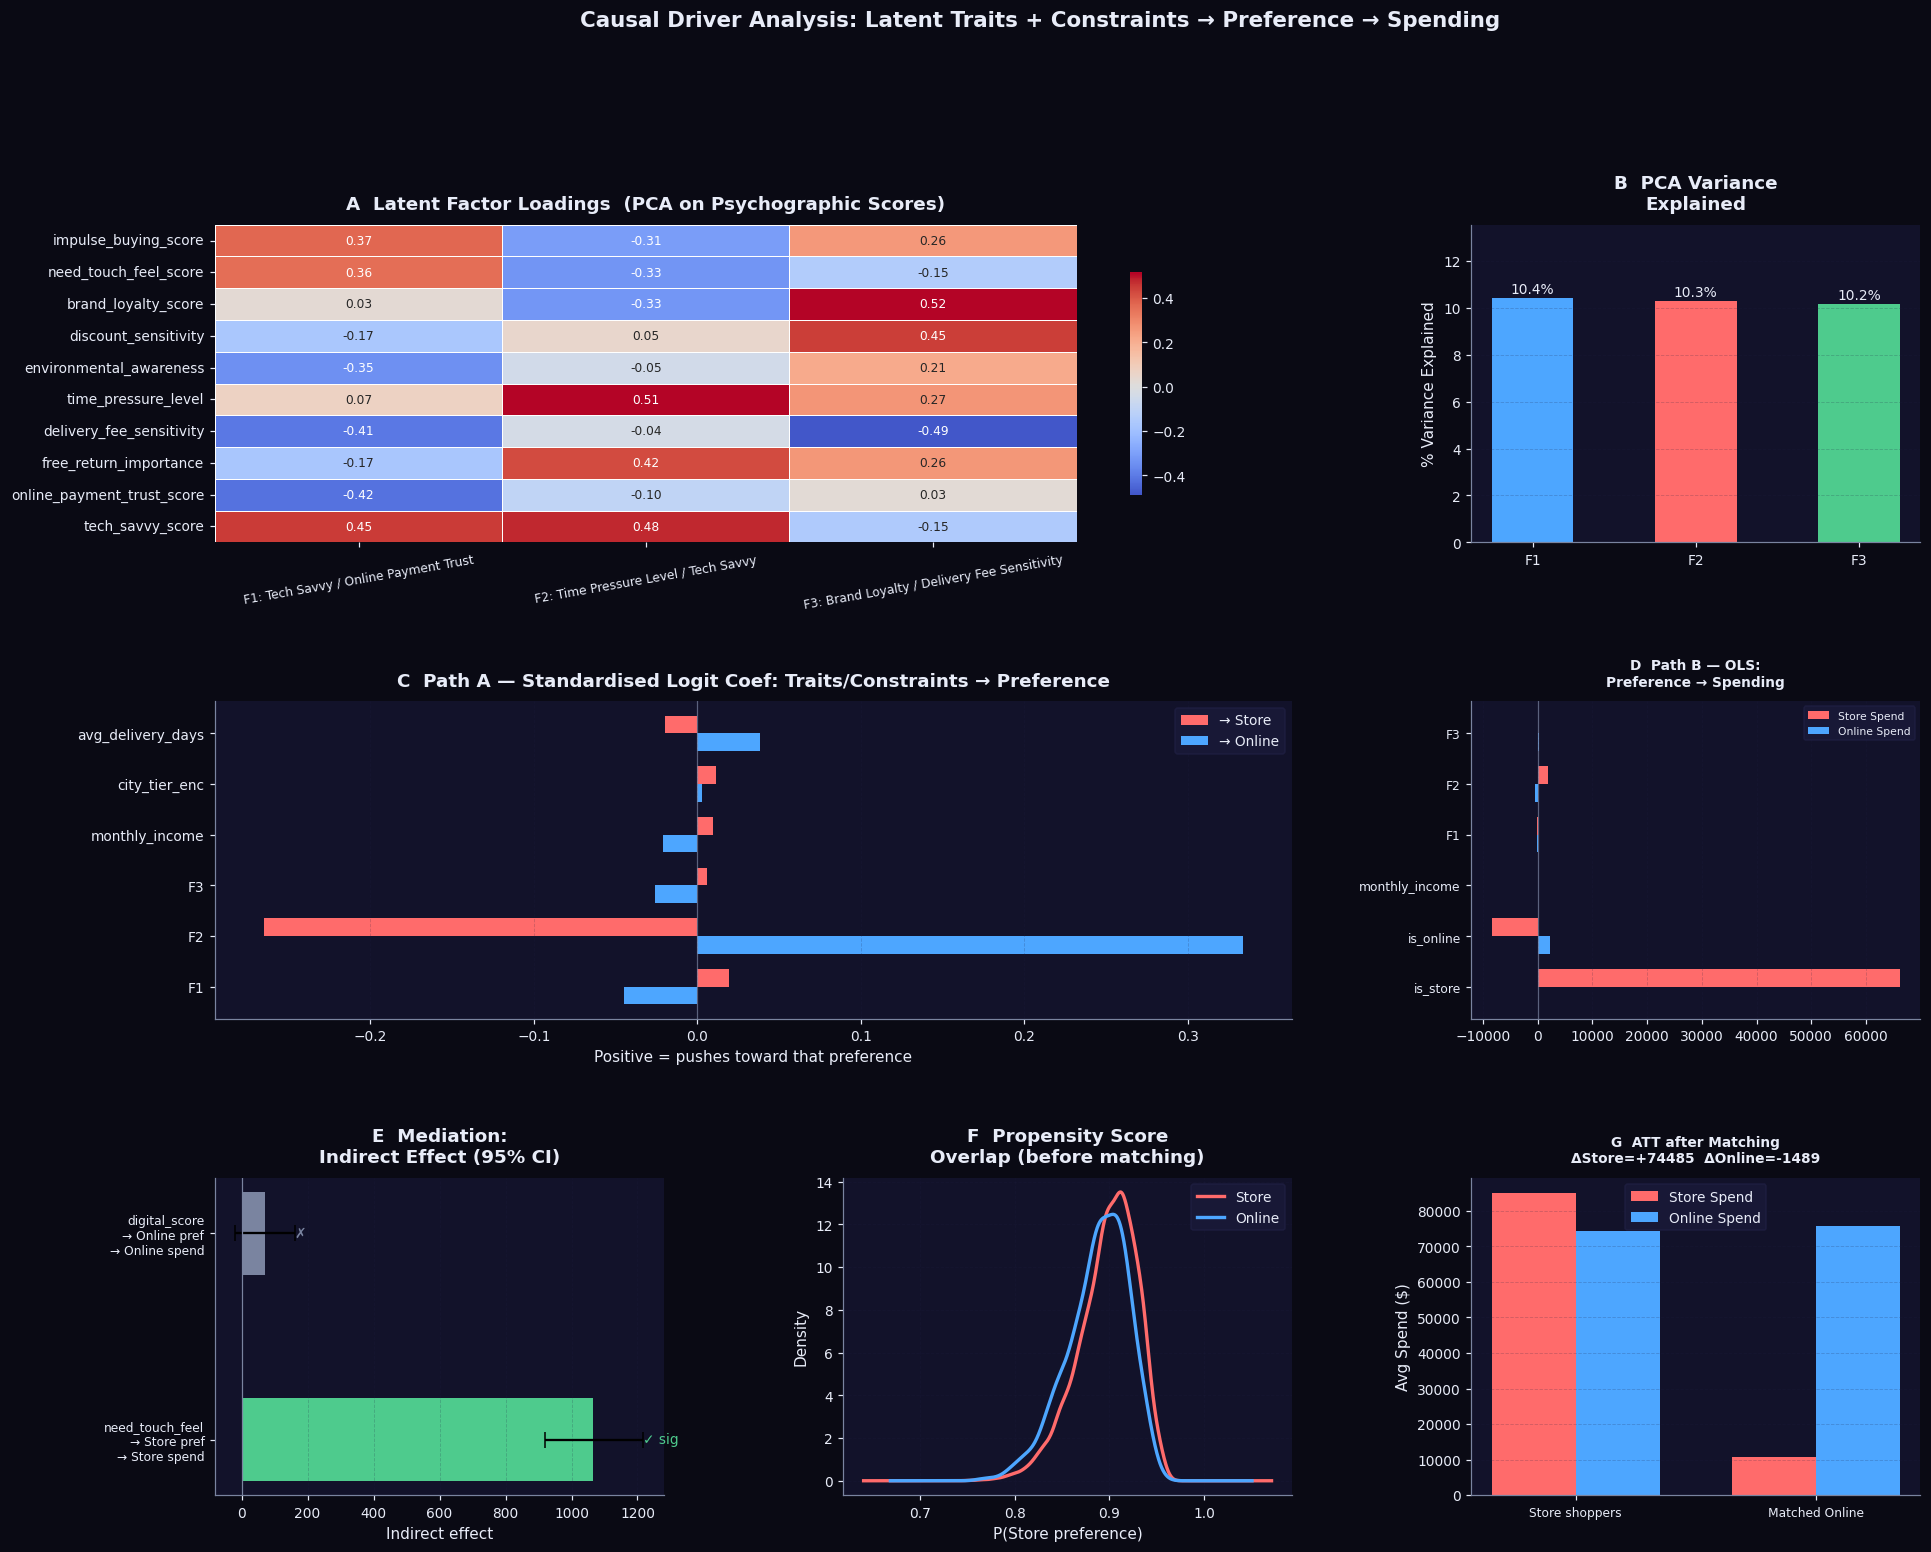
- Causal Inference — Structural path model (logit: latent traits → preference; OLS: preference → spend); bootstrap mediation with 95% CI; propensity-score matching (ATT) to isolate spending differences net of selection bias
- Feature Engineering — Composite digital score, channel-mix ratio, income/age cohort bins; full
StandardScaler+LabelEncoderpipeline
Python scikit-learn XGBoost LightGBM SHAP Plotly Seaborn Statsmodels K-Means PCA Propensity Score Matching